Table of Contents
- Build Your Trading Strategy
- Price Range
- Marubozu Candlesticks
- A Lesson In Pure Price Action: Context Of Supply And Demand
- Candlestick Components
- Fundamental Analysis
The buy trigger forms when the next candlestick exceeds the high of the bullish engulfing candlestick. If the preceding candles are bearish then the doji candlestick will likely form a bullish reversal. Long triggers form above the body or candlestick high with a trail stop under the low of the doji.

These rice contracts were then being sold and bought by speculators, becoming the world’s first futures market. You can see that advancing prices are usually accompanied with empty lines and that declines are accompanied with filled-in lines . The pattern is similar to a harami, except the second line is a doji . It occurs when a line with a small body falls within the area of a larger body. It occurs when the open and close are the same, and the range between the high and low is relatively large.
Build Your Trading Strategy
As the bearish harami candlestick closes, the next candle closes lower which starts to concern the longs. When the low of the preceding engulfing candle broken, it triggers a panic sell-off as longs run for the exits to curtail further losses. The conventional short-sell triggers form when the low of the engulfing candle is breached and stops can be placed above the high of the harami candlestick. The harami is a subtle clue that often keeps sellers complacent until the trend slowly reverses.
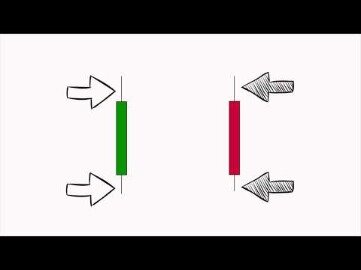
Here is your basic construction of a Japanese Candlestick. When the candle is hollow, the close is above the opening price and when the candle is filled , the close is below the open. This goes for any period in question, whether you’re looking at a daily candlestick, weekly candlestick or even intraday like a 5-minute or 30-minute period. A star is a line with a small real body that occurs after a line with a much larger real body, where the real bodies do not overlap. This pattern is strongly bearish if it occurs after a significant up-trend (i.e., it acts as a reversal pattern). It occurs when a small bullish line is engulfed by a large bearish (filled-in) line. A “star” indicates a reversal and a doji indicates indecision.
Price Range
When they appear near support or resistance levels and match up with Western charting techniques that we really pay the most attention. After hearing the expression, “dark-cloud cover,” would you think the market is in an emotionally healthy state?
This is because there are events which occur over the weekend that can effect price to where it may not open exactly where it closed on Friday. Sometimes these gaps are small, sometimes as large as 100 pips or more. For this reason, many Forex traders will avoid holding positions over the weekend. If you’ll notice, the market doesn’t always open exactly where it closed.
No system candle predict the success of trades with complete fidelity. As in all decision making, it’s important to balance your moves with multiple resources. The best forex broker for most people is definitely FOREX.com or IG. Bullish white lines occurred at points “1,” “2,” and “3” .
Marubozu Candlesticks
The answer is that candles have a lot of qualities which make it easier to understand what price is up to, leading traders to quicker and more profitable trading decisions. Japanese candlestick charts are believed to be one of the oldest types of charts in the world. It was originally developed in Japan, several centuries ago, for the purpose of price prediction in one of the world’s first futures markets. Below you will find a dissection of 12 major signals to learn how to use Japanese candlesticks.
I think people take this stuff too seriously and those provided memorable back up for the patterns and broke up the book nicely. If you are completely novice you might get a little headache at start but the book has so many good examples that you’ll soon start to follow along. Especially if you put some practice to it and start to gain experience. This book is a solid, easy to understand foundation to built upon. Nothing can replace experience but with the tools in this book you stand a chance of having a better chance of learning from that experience. Most of the patterns and techniques here are still applicable, no matter how laughable that may sounds to you at first. With the abundant availability of public historical data at the present you can even test these techniques empirically and be amazed .
This is a bearish pattern and the name clearly conveys the unhealthy state of the market. Personally, I prefer to take the visual benefits of Japanese Candlesticks one step further. If the closing price of the candlestick in question is above the prior period’s closing price, I want a green candle. If the closing price of the current candle is below the prior period’s close, I want a red candle. This red/green combination is often seen in other kinds of charts as well, like bars. The interpretation of candlestick charts is based primarily on patterns. I have met investors who are attracted to candlestick charts by their mystique–maybe they are the “long forgotten Asian secret” to investment analysis.
A Lesson In Pure Price Action: Context Of Supply And Demand
Spinning top black This pattern indicates the indecision between the buyers and sellers. Long legged doji Prices moved above and below the open price, but the close price equals the open price. Dragonfly doji The open price equals the close price and they both are the same as the high price.
What software do professional day traders use?
TD Ameritrade.
LightSpeed.
CMEG.
TradeStation.
WeBull.
Robinhood.
Trade Ideas.
Benzinga.
More items
A bullish engulfing pattern forms at the bottom of a downtrend when the candle body completely engulfs the prior red candle including the highs and lows. A bearish engulf candle is the opposite as it forms at the top of the trend with a red candle body that completely swallows the high and low range of the prior green candle. Throughout the years, the practical nature and efficiency of candlesticks lent to their explosion in popularity. The adoption of candlestick charts by most trading platforms have made them the standard type of stock chart used by traders. Candlestick charts can be used across all financial instruments along with numerous indicators and patterns to develop trading strategies. They are easy to understand, convenient to use and enable efficient price interpretation. A stock chart is a graphical display of executed trades and various other data to provide a visual representation of the price action on the underlying stock.
Trivia About Japanese Candlest ..
One example is when you get a big bullish candlestick to complete a breakout above former resistance. Either switch your chart to a 65-minute timeframe so you have six candles of equal length each day or further reduce your timeframe down to 30 minutes of data. With 30 minute data periods each day will have 13 individual candles of equal length. We are going to get into candlesticks and how we can incorporate them into our process. But the one thing that I want to make perfectly clear is that we do not want to be one of those guys over analyzing every single candlestick. It is important to be aware of them, but where they occur is what we’re most concerned with. So keep that in mind while we go through this particular topic.
Think about the tiny toy that was the inspiration for the naming of the pattern. TradingHeroeshas a great article about Forex gap trading; make sure you check it out. Now, the cool thing is that indecision will rarely maintain any trend. Instead, they usually occur slowly, in stages, as the market psychology shifts. The high and low points of the candle simply marked by the peak of the upper wick and the bottom of the lower wick.
Candlestick Components
The first half of the book talks precisely about this, and it gets boring and repetitive very quick. But they are clearer than bar charts or line charts at showing what might have happened during a time period. So, even if they don’t provide much of an edge, for me they are still the clearest picture I can get.
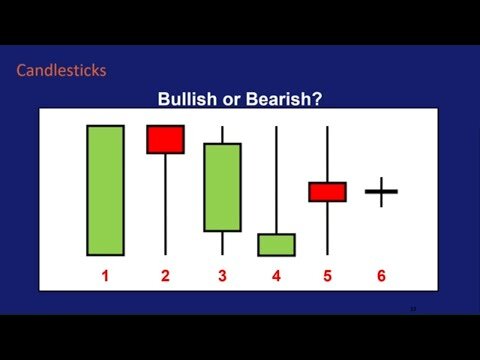
How many candlestick patterns are there?
16 candlestick patterns every trader should know. Candlestick patterns are used to predict the future direction of price movement.
A Japanese candlestick is a type of price chart that shows the opening, closing, high and low price points for each given period. It was invented by Japanese rice merchants centuries ago, and popularised among Western traders by a broker called Steve Nison in the 1990s. Here’s our rundown of the 18 Japanese candlestick patterns you need to know, plus a cheat sheet reference guide to help you spot opportunities as soon as they arise. The body of a Heiken-Ashi candle does not always represent the actual open/close.
No communication from Rick Saddler, Doug Campbell or this website should be considered as financial or trading advice. All information is intended for Educational Purposes Only. Yes please, send me offers about trading related products and services. By subscribing we will send you education emails about Forex trading. In fact, they will be disappointed with trading in general. So, when you see a spinning top, be aware that it can be a sign of an upcoming reversal. Obviously, we can’t know how many traders are sitting on the sidelines about to buy or sell.
I will go through some of the most important candlestick patterns and will explain to you their potential. Also, when doing ratio analysis, I prefer not to use Japanese Candlesticks. There are many reasons why, but mostly because we are analyzing one security relative to another over time. Since I use this for trend recognition, a line chart connecting closing prices is more than enough for me. Also, the reason we use candlesticks is that they tell a much better story visually than other types of charts. But in the case of ratio analysis, I don’t need the intra-period story. In fact, when looking at ratios between two ETFs, let’s say, one might open before another one, so the “story” being told by the candle is probably being driven by incorrect information.