Table of Contents
- Flag Pattern Take Profit
- How To The Double Top And Bottom Chart Pattern
- What Is A Flag Pattern?
- Rising Wedge Pattern
- Bearish Flag
If this pattern was to form at the bottom of a downtrend, then traders could watch for a possible market reversal and change in the trend direction. As a trader, you have to understand that no indicator or pattern is perfect, and nothing would be all the time right. It would help if you also looked after other things such as global events and other price trends to jump into the market. The best you can do is keep yourself updated and learn from your mistakes. As we can see in Figure 1, if on the chart, the main trend is the rising trend in some moment, retracement will happen. Interestingly, this consolidation range will happen between 23.6 till 50% (Fib. levels) retracement range.
- As you might expect, it’s the exact opposite of the bull flag we just studied.
- In a bearish flag pattern, the volume does not always decline during the consolidation.
- This area is a rectangle in the flag, and has a triangular shape for a pennant.
- Before entering a trade based on this formation, you of course need to have a predetermined entry point, stop-loss and profit target.
- For the target objective, measure the distance between the neckline and the head.
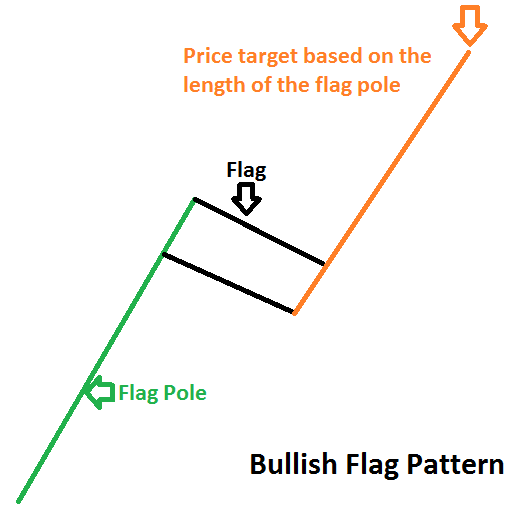
A flag pattern is a trend continuation pattern, appropriately named after it’s visual similarity to a flag on a flagpole. A “flag” is composed of an explosive strong price move that forms the flagpole, followed by an orderly and diagonally symmetrical pullback, which forms the flag. When the trendline resistance on the flag breaks, it triggers the next leg of the trend move and the stock proceeds ahead.
Flag Pattern Take Profit
Now on your remaining trade, you adjust your stop again so that it will be located just below the second target. If the price continues to trend upwards, then you could carefully monitor price action and hold the last 1/3 of the trade position for as long as it seems prudent. If you have a bullish flag, you will buy the Forex pair when the price action closes a candle above the upper side. If you have a bearish flag, then you would sell the pair when you see a candle closing below the lower level of the pattern. As price action traders, it’s times like this that we need to be on high alert for favorable breakout opportunities. It allows us to catch the trend as it resumes and gives us the ability to protect our capital with a strategically placed stop loss. The bullish flag pattern is created when price is in a strong trend higher.
Perfectly structured with step-by-step guides to help you understand the principles of price action analysis. For the Inverted Cup & Handle pattern, you can sell when the market breaks below the low of the cup or when the handle pullback breaks down. A Cup & Handle pattern is basically a Rounding Bottom following by a pullback. Hence, it marks a period of consolidation in which the bulls take over from the bears gradually. By the same logic, a Descending Triangle pattern, with the lower swing highs, is a bearish pattern. The first gap represents a climatic move aligned with the existing trend. However, instead of following through with the gap’s momentum, the market meanders.
Trading examples of chart patterns are usually textbook examples. The purpose is to show the ideal form of chart patterns working effectively.
How To The Double Top And Bottom Chart Pattern
This swift and sudden price movement is an indication of strong buying or selling action. It is relatively easy recognizable once you know what to look for. Flag patterns are short-term patterns that typically extend 1 to 4 weeks. risk to reward ratio you can set your stops in the middle of the pattern. The symmetrical triangle shows an area where the market was consolidating before picking up again. Plus, our latest trading guides and tips in right your inbox. An Inverted Cup & Handle pattern follows a similar logic with a Rounding Top and a pullback upwards.
He has provided education to individual traders and investors for over 20 years. He formerly served as the Managing Director of the CMT® Program for the CMT Association. Cory Mitchell, CMT, is a day trading expert with over 10 years of experience writing on investing, trading, and day trading. Mitchell founded Vantage Point Trading, which is a website that covers and reports all topics relating to the financial markets. He has a bachelor’s from the University of Lethbridge and attended the Canadian Securities Institute from 2002 to 2005. As you can see, The Pennant formation is very similar to the Flag pattern, and the same rules apply for trading both.
This is one of the easiest patterns to spot and also one of the most useful in your price action analysis. This pattern is normally used as a continuation if it is formed during a downtrend. If however; it is formed during an uptrend, you could watch for a potential reversal and change in the trend direction. If you are an aggressive trader you can take an entry when price breaks either the high or low of the pennant and look for price to continue. This pattern is created when price makes a large move either higher or lower and then begins to move sideways and consolidate.
What Is A Flag Pattern?
A flag is a relatively rapid chart formation that appears as a small channel after a steep trend, which develops in the opposite direction. The pattern is often characterized by a sharp price entering after intensive movement. Identify the current market trend and find a flag pole to confirm the trend. The FlagPole is the primary and significant component of a Flag pattern. The flagpole is the beginning and the ending part of a flag that represents an impulsive momentum. In the Flag pattern, we will trade the impulse after a correction.
Thus, we enter at 10% above its height , at 1.7103, as marked by the purple horizontal line. Our stop is placed 25% of the poles height below the entry (or 15% beneath its high – 7.2 pips), at 1.7091 – visualized by the red horizontal line. If after/before the breakout, a medium orchid downward pointing arrow of the Super Signal v3 custom indicator is sustained above price bars as seen on Fig.
Rising Wedge Pattern
The formation above was, in fact, an upward sloping flag and thus represented trend exhaustion more so than a continuation of the current uptrend. Now that we’ve identified the Forex flag pattern let’s move on to the meat and potatoes of today’s lesson.
However, the longer the consolidation, the more aggressive the breakout is likely to be. This flag runs between parallel lines, moving upwards, downwards or sideways. It is usually the sideway angles or slightly downward angle flags that are usually followed by sharp moves higher. We’ll get into how to trade these price action patterns in a later lesson. For now, just focus on being able to identify these patterns – they occur all the time and can be a powerful asset in your trading toolbox. This is the point at which, after a strong move in price, the market consolidates for a period of time. The length of time is irrelevant, however do note that longer consolidation periods tend to lead to more aggressive breakouts.
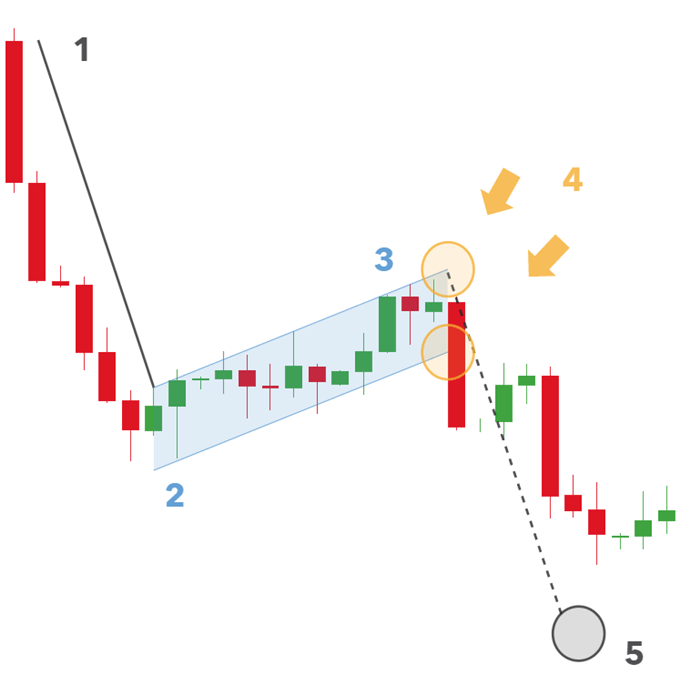
This confirmed the pattern, which creates a long opportunity on the chart. The green circle is the appropriate time in which to buy the GBP/USD Forex pair. Notice the bullish Flag pattern starts with a bullish Flag Pole, which turns into a bearish correction. Upon breakout of the upper channel line, we expect to see a continuation of the prevailing bullish trend. Upon breakout of the lower channel line, we expect to see a continuation of the prevailing bearish trend.
The flag pattern is used to identify the possible continuation of a previous trend from a point at which price has drifted against that same trend. Should the trend resume, the price increase could be rapid, making the timing of a trade advantageous by noticing the flag pattern. As with Flags, there are two types of Pennants – bullish Pennant and bearish Pennant. They are traded the same way as the Flag and the target rules are absolutely identical.
Click here to download our cheat featuring all the patterns that were explained in this guide. Notice that you should protect your trade with a Stop Loss order that needs to go below the lowest bottom of the Falling Wedge pattern, as shown in the image. Your Stop Loss order in a Head and Shoulders trade should go above the second shoulder of the pattern. In addition, the two pink arrows show the size of the Flag and the Flag Pole, applied starting from the moment of the Flag breakout. The Stop Loss order of this trade stays below the lowest point of the Flag as shown on the image. Each of these six formations has the potential to activate a new impulse in the direction of the previous trend.
So, if you continue to see signs of a strong trend even after Target 2 has been reached, then by all means, keep a portion of the position open. Make sure to manage your trade using price action based clues to determine a final exit point. After creating the pole, a valid Flag pattern will then begin to trade within a tight range, taking on the shape of a Flag. The Flag consists of price action with evenly distributed tops and bottoms. At the same time, this price action has a corrective character on the graph. In this manner, it is angled contrary to the trend impulse creating the pole. In other words, the price is likely to continue moving in the direction of the primary trend once the currency pair breaks above or below the pennant or flag pattern.
If the Flag is bullish, you go long when the price breaks the upper level of the Flag. If the Pennant is bullish, you go long when the price action breaks the upper level of the triangle correction. Once the trade is executed, you should put your initial stop loss right below the lowest point of the flag as shown on the image (S/L 1). Then with each target the Stop Loss order should be moved upwards, locking in profits as price advances. The two-other trailing stop loss orders are shown with S/L 2 and S/L 3. Most times, after the Flag completes the two targets, you would want to close out the entire position and bank your profits. But in some instances, you may decide to keep a small position open to ride out a larger trend move.
Bearish Flag
The Flag and the Pennant are two separate chart patterns that have price continuation functions. However, we like to treat these as one as they have a similar structure and work in exactly the same way. For example, let’s suppose the Forex pair is trending in the bullish direction. You should wait to see in which direction the pattern will break. This will give you a hint about the potential of the pattern. These formations signal a price move, but the direction is unknown. In the process of the pattern confirmation, traders realize the pattern’s potential and tackle the situation with the respective trade.
To identify a rising wedge chart pattern you will need to spot price forming upward sloping support and resistance levels. To better predict the trend, traders often use other indicators like volume or price action. Setting a profit target differs from trader to trader, though many traders prefer to consider the difference between high and low in deciding the target. For example, if the difference is $5, and the breakout happened at $20, the profit target would be $25.
We’re also a community of traders that support each other on our daily trading journey. However, this doesn’t cause a rapid decline in price, as bullish traders begin buying, hoping to capitalize on future increases in price.