Table of Contents
- A Way To Look At Prices
- Cl1! Futures Chart
- The History Of Candlestick Patterns
- Bearish Engulfing Pattern
- Live Chart
- Candlestick Components
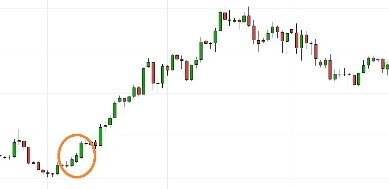
Do never try to trade a candlestick pattern all by itself, but use it as inspiration, and try to come up with your own trading strategy. In the image below, you see that the small bearish reversal candles made a relatively smaller move than the big bullish engulfing candle, which brought a bigger move. If the candlesticks that formed the pattern are larger than the rest of the candles, the move may have some strength and the pattern may play out well. On the other hand, if the candlesticks in the pattern are smaller than the other candles, it may indicate weakness, and the pattern may not play so well. When you compare the size of the candlesticks in the pattern to the other candlesticks around, you can gauge the level of conviction of the traders behind the move. It tells you the strength of the dominating party — bulls or bears.
The depth of information and the simplicity of the components make candlestick charts a favorite among traders. The ability to chain together many candlesticks to reveal an underlying pattern makes it a compelling tool when interpreting price action history and forecasts. The Japanese have been using candlestick charts since the 17th century to analyze rice prices. Candlestick patterns were introduced into modern technical analysis by Steve Nison in his book Japanese Candlestick Charting Techniques.
A Way To Look At Prices
The candlestick chart provides a lot of useful information about what price has done within the specified timeframe. And with its color coding and visible shapes and patterns, you can easily see what’s happening in the market at a glance. Traders rely on Japanese candlestick charts to observe price action of financial assets. Candlestick graphs give twice more data than a standard line chart and interpret price data in a more advanced way and offer distinct, comprehensive patterns. As with the hammer formation, a trader would place a stop loss below the bullish engulfing pattern, ensuring a tight stop loss. The image below represents the design of a typical candlestick. There are three specific points used in the creation of a price candle.
- The smaller chart time frame you switch to, the closer you look into price action.
- Dozens of bullish and bearish live candlestick chart patterns for the Horizons Crude Oil ETF and use them to predict future market behavior.
- There’s a host of charting software out there, including several free options.
- This analysis relies on the work of Thomas Bulkowski, who built performance rankings for candlestick patterns in his 2008 book, “Encyclopedia of Candlestick Charts.”
- The bullish hikkake pattern is a multiple-candlestick pattern that may indicate a potential bullish reversal when occurring after a bearish price swing.
The dragonfly is a type of doji candlestick where the open, high, and close prices of the session are at the same level, but the session traded lower at some point. However, nothing is certain in the market; although the price may continue going up, it can also change direction without warning.
Cl1! Futures Chart
A bearish engulfing pattern develops in an uptrend when sellers outnumber buyers. This action is reflected by a long red real body engulfing a small green real body. The pattern indicates that sellers are back in control and that the price could continue to decline. A short upper shadow on an up day dictates that the close was near the high. The relationship between the days open, high, low, and close determines the look of the daily candlestick. Trading is often dictated by emotion, which can be read in candlestick charts. Candlestick chartsoriginated in Japan over 100 years before the West developed the bar and point-and-figure charts.
You can represent a bearish candlestick with any color you want, but black or red is usually the color of choice for a bearish candlestick. The upper wick lies between the period’s high and open prices while the lower wick lies between the session’s low and close prices. The inverted hammer has a long upper candlewick and a small body in the lower part of the candle. Same as the hammer, an inverted hammer appears during bearish trends. The hammer candle family is another single candlestick pattern.
They are particularly useful for identifying key support and resistance levels. A slight variation of this pattern is when the second day gaps up slightly following the first long up day. Everything else about the pattern is the same; it just looks a little different.

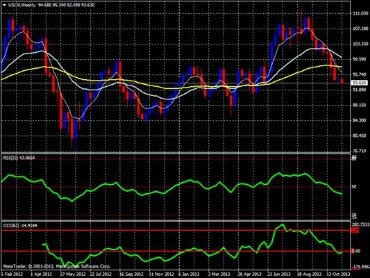
With bulls having established some control, the price could head higher. The above chart shows the same exchange-traded fund over the same time period. The lower chart uses colored bars, while the upper uses colored candlesticks. Some traders prefer to see the thickness of the real bodies, while others prefer the clean look of bar charts. Bar charts and candlestick charts show the same information, just in a different way.
The History Of Candlestick Patterns
This is also a weaker reversal signal than the Morning or Evening Star. The Evening Star pattern is opposite to Morning Star and is a reversal signal at the end of an up-trend. The pattern is more bearish if the second candlestick is filled rather than hollow. How one candlestick relates to another will often indicate whether a trend is likely to continue or reverse, or it can signal indecision, when the market has no clear direction. A gravestone is identified by open and close near the bottom of the trading range. The candlestick is the converse of a hammer and signals reversal when it occurs after an up-trend. Get the MCX Live Charts of the 24 commodities listed on the multi commodity exchange of India.
How can I deal with the fact that different charting platforms show different candlestick patterns because of their time zone? Forex market, we would suggest to use a GMT chart since most institutional volume is handled in London. This is specially valid if you work with daily charts but intraday charts superior to 1 hour will also show differences in the patterns. In any case, because of the 24 hour nature of the Forex market, the candlestick interpretation demands a certain flexibility and adaptation. You will see how some of the textbook patterns look slightly different in Forex than in other markets. While the arithmetic shows price changes in time, the logarithmic displays the proportional change in price – very useful to observe market sentiment.
Many traders just trade bearish reversal pattern in a downtrend. The bearish abandoned baby is another 3-candlestick bearish reversal pattern. The fact the bearish candle manages to engulf the preceding bullish candle, is a strong sign that the sellers are in power for the moment. Another way of increasing your odds is to ensure that the market is oversold before you take the signal.
Bearish Engulfing Pattern
It occurs when trading has been confined to a narrow price range during the time span of the candle. Although this candle is not one of the most mentioned ones, it’s a good starting point to differentiate long candles from short candles. A marubozu is a single candlestick pattern which has a very long body compared to other candles. Although this is considered a confirmation of the market’s direction, it suggests to enter the move when the price has already moved a lot. The resulting risk associated with this signal makes the marubozu not so popular compared to other candlesticks. Before you can understand trading strategies and candlesticks, you must have a solid understanding of what is behind the creation of candlesticks. There are many conventional candlestick patterns in use today by traders around the globe.
The timeframe would determine the significance of the candlestick patterns. A reversal pattern you see on a 1-minute chart will not be as significant as the one you see on a daily timeframe.
However, day trading using candlestick and bar charts are particularly popular as they provide more information than a simple line chart. The bearish three black crows reversal pattern starts at or near the high of an uptrend, with three black bars posting lower lows that close near intrabar lows.
Candlestick charts are a visual aid for decision making in stock, foreign exchange, commodity, and option trading. Looking at a candlestick, one can identify an asset’s opening and closing prices, highs and lows, and overall range for a specific time frame. Candlestick charts serve as a cornerstone of technical analysis. For example, when the bar is white and high relative to other time periods, it means buyers are very bullish. Pattern # Stocks Description Doji 401 Stocks One candle, where the opening and closing prices for today are the same. Doji Yesterday 273 Stocks One candle, where the opening and closing prices for yesterday were the same.
The same difference between price and value is valid today with currencies, as it was with rice in Japan centuries ago. Compared to the line and bar charts, candlesticks show an easier to understand illustration of the ongoing imbalances of supply and demand.
Once the following candle closes above the high of the inside bar, there is a breakout. A tweezer top shows that the high has been successfully defended by bears. In a much lower timeframe, you would see a double top price structure. For instance, a tweezer top on the daily timeframe would be a double top on the 1-hour or 30-minutes timeframe. From the image above, you can see a hammer candlestick bouncing off a support level, and the stochastic crossed to start ascending.
This is a 2-candlestick bearish reversal pattern which appears after a bullish price swing. The morning star pattern is a 3-candlestick bullish reversal pattern which forms at the end of a bearish price swing. The bullish hikkake pattern is a multiple-candlestick pattern that may indicate a potential bullish reversal when occurring after a bearish price swing.
Once the price exceeds the top or bottom of the previous brick a new brick is placed in the next column. You’ll see white bricks when the trend heads upwards and black bricks when the trend goes down.
His prowess at gaming the rice trading markets was legendary. It is believed his candlestick methods were further modified and adjusted through the ages to become more applicable to current financial markets. Steven Nison introduced candlesticks to the Western world with his book “Japanese Candlestick Charting Techniques”. Candlesticks have become a staple of every trading platform and charting program for literally every financial trading vehicle.